Introduction
The calculator’s results are designed to illustrate the key technical and economic aspects of an aquaponics project.
The output categories help to better understand land use, production potential, cost structures, and key economic indicators. To ensure the results are interpreted correctly, we explain the most important elements of the output below.
Economic indicators
The key figures at the top of the output summarize the central economic results of the calculation in a concise format.
They provide a quick overview of the fundamental economic classification of the modeled project. These key figures are particularly helpful as an initial guide, but should not be considered in isolation. Their significance always arises in conjunction with the underlying assumptions, the additional charts, and the tabular analyses at the bottom.

Net present value
The internal rate of return (IRR) describes the calculated return on the capital invested within the modeled project.
It is a key indicator of the project’s economic attractiveness. The higher this value, the more favorable the relationship between capital investment and expected returns appears within the model.
Return on capital
The return on capital shows how much the invested capital earns in relation to the expected economic outcome.
It serves as a further benchmark for assessing the project’s profitability. Again, its significance always depends on the underlying assumptions and the actual conditions achievable on site.
Payback period
The payback period indicates the time it takes for the invested capital to be recouped in the model.
It is particularly helpful because it provides an idea of how long a project needs to recoup the initial investment. Shorter payback periods generally have a more favorable impact on the economic evaluation than very long ones.
Net cash flow
The net cash flow shows the annual surplus remaining in the model after deducting operating costs.
It is an important indicator of the project’s economic viability, as it reveals what remains of the projected revenues after accounting for the major cost categories. Especially when combined with the other diagrams, it clearly shows which factors have the strongest economic impact on the project.
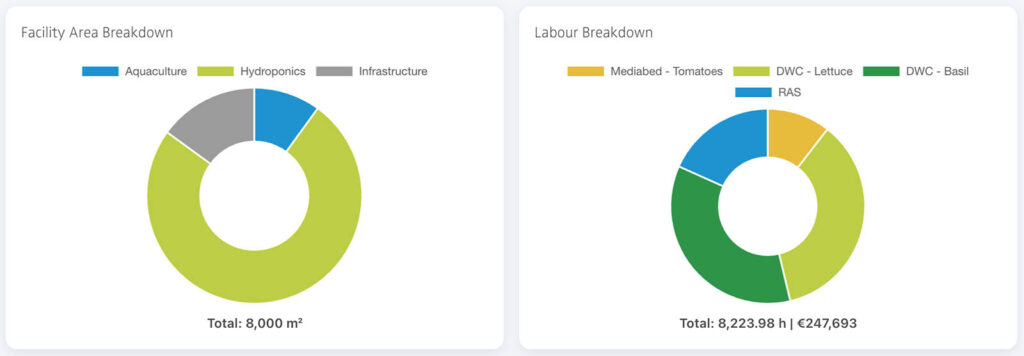
Area allocation and workload
The area breakdown shows how the gross area entered into the calculator is distributed across the central functional areas of the facility within the model. These include, in particular, the aquaculture, hydroponics, and infrastructure areas. This visualization helps to understand the basic structure of the modeled project and the relationships between the individual functional areas at a glance.
The labor input by production area shows how many working hours per year are required in each production area.
The individual cultivars from the selected plant crops are shown, as well as the labor input in aquaculture. Furthermore, the graphic displays the totals for the area and labor input at the bottom.
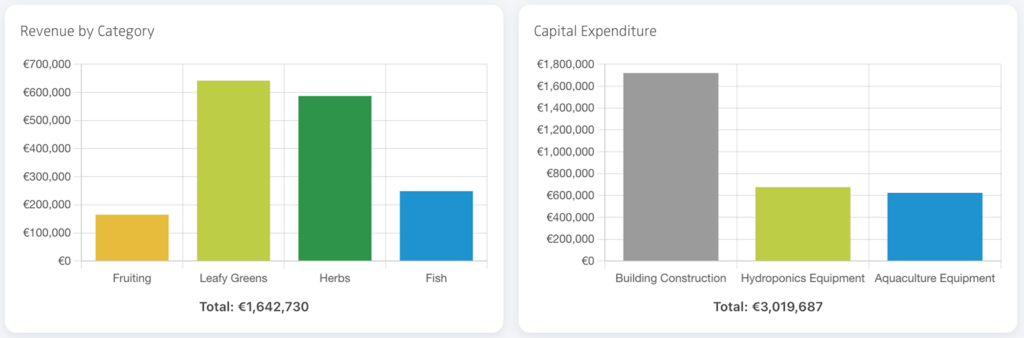
Revenues and capital expenditures (CAPEX)
The next two charts show the revenue generated by the different crops. These are based on the sales prices specified in the input for the various product categories. These are contrasted with the investment costs incurred, broken down into infrastructure/building construction, hydroponic equipment, and aquaculture equipment.
This breakdown is particularly helpful in the early stages of project evaluation because it highlights the main investment priorities. However, the charts represent modeled costs based on the selected inputs and underlying assumptions. Actual investment costs may vary significantly depending on location, construction method, supply chain, and level of execution.
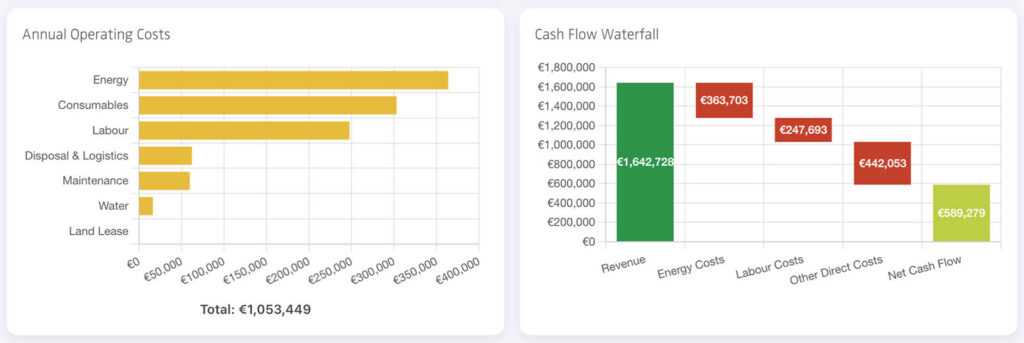
Annual operating costs
The annual operating costs show which ongoing cost categories significantly influence the economic operation of the plant in the model.
In particular, costs for operating resources, personnel, maintenance, waste disposal and logistics, water, energy, and, if applicable, lease payments are presented. This makes it clear which ongoing expenses will have the greatest impact during later operation.
This presentation helps to identify key cost drivers early on and to better assess the economic structure of the project. However, it should be noted that these are modeled values based on the chosen assumptions. Actual operating costs can vary considerably depending on local conditions, price levels, operating methods, and existing infrastructure.
Cash flow waterfall chart
The cash flow waterfall diagram illustrates in a condensed form how the revenues projected in the model are gradually reduced by the most significant cost categories to arrive at the net cash flow.
Starting with the total revenues, it becomes clear what impact energy costs, personnel costs, and other direct costs, in particular, have on the financial result. This visualization is especially useful for understanding the economic logic of the project at a glance.
This graphic is particularly helpful for initial assessment because it not only shows a final value but also illustrates the process leading up to it. This allows for a quicker identification of which cost categories are most burdensome for the project and where changes to the assumptions could have a noticeable impact on the net cash flow.
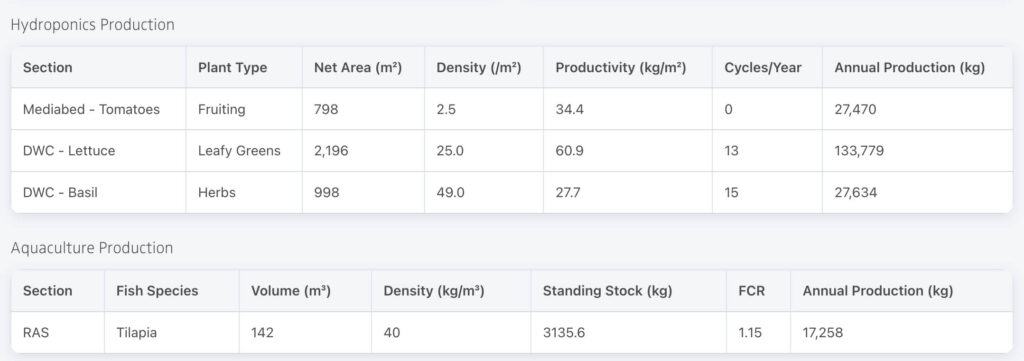
Aquaponics production
The tabular production overview displays the performance data for the hydroponics and aquaculture areas derived from the model.
Key metrics such as net area, fish and plant density, productivity, cycles per year, volume, average stock, and annual production are shown. The tables thus make transparent the production-related basis on which the calculator’s economic analyses are founded.
These output sections are particularly helpful because they not only summarize the model logic but also reveal it. This allows users to understand the underlying production assumptions and how the displayed revenues, costs, and key performance indicators are derived from them.